Sometimes, it can be challenging to understand why a particular ad is displayed in a specific zone. Another common issue is having blank zones, and it is unclear why they occur. A debugger tool should help you address those issues easily since it lets you see how an ad-serving engine works under the hood.
When It Helpful
When managing your ads, you may encounter various issues that can be resolved using a debugger. You can get answers to the following questions quickly:
- Why is a particular ad displayed in a specific zone?
- Why is a particular zone blank (no ads displayed)?
- Why is a particular ad winning an auction?
- What is the response I get from 3rd party RTB/XML/JSON endpoint? (in case of a programmatic selling)
- What request do I send to 3rd party RTB/XML/JSON endpoint?
Where to Find Debugger
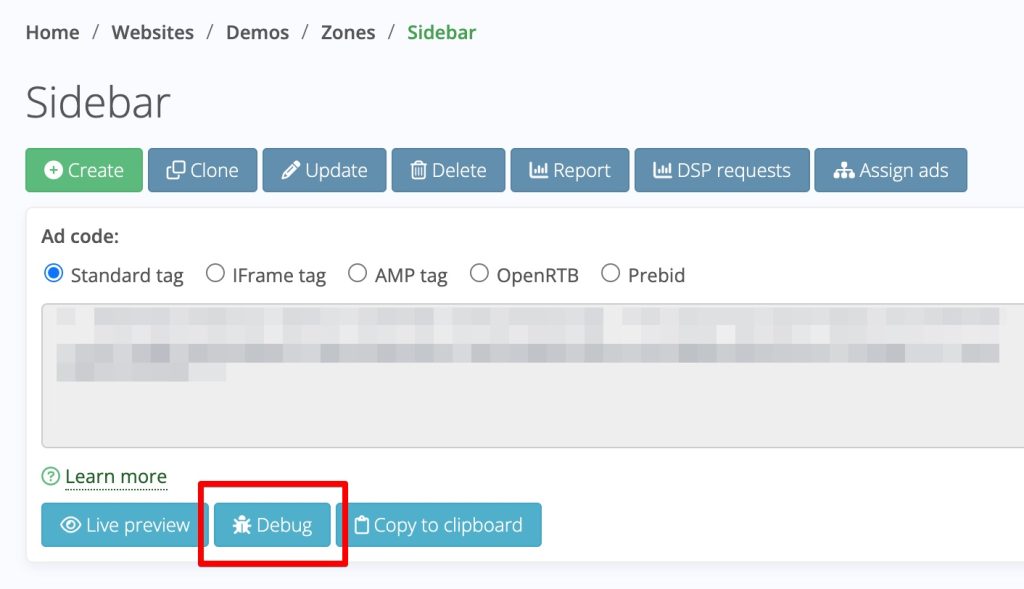
The debugger is a zone-specific tool. So it's located on the zone page.
You need to go to the Websites menu, find a website, and click on the needed zone name. After that, click the Debug button on the zone page.
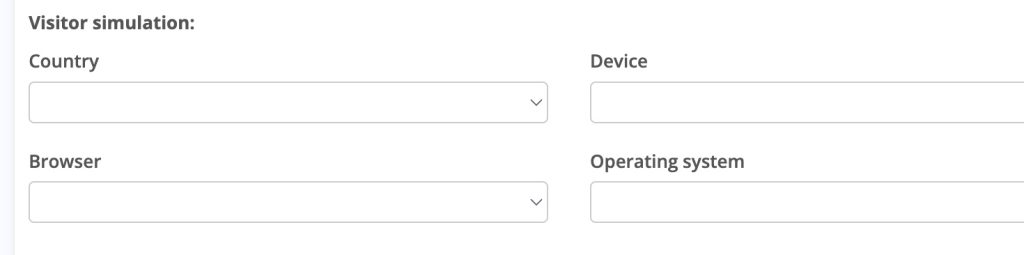
Visitor Simulation
By default, Debugger assumes that you are an ad watcher, so your browser and IP address are used to check targeting.
You can simulate another user by selecting its parameters on the debugger form: